
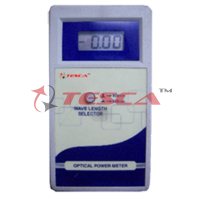
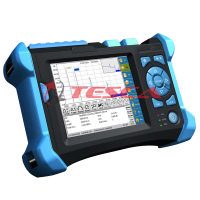
Optical Spectrum Analyser
Order Code: 28564
Category: Fiber Optic Trainers
Feature S, C and C+L Band Wavelength Ranges High wavelength repeatability Excellent wavelength accuracy: +/- 0.3 nm No mechanical wear-outs Channel Power Measurement Channel Threshold Detection Multiple traces viewed simultaneously ...
SPECIFICATION
Feature
- S, C and C+L Band Wavelength Ranges
- High wavelength repeatability
- Excellent wavelength accuracy: +/- 0.3 nm
- No mechanical wear-outs
- Channel Power Measurement
- Channel Threshold Detection
- Multiple traces viewed simultaneously
- User-friendly GUI for Measurement and Analysis
Optical Spectrum Analyzer consists of a narrow-band tunable optical filter, a photo-detector and low noise, highdynamic range electronics, as schematically shown in Fig 1.
When a wide band spectrum is incident to the tunable filter, it allows a narrow band out of input light centred at a given wavelength to pass through the filter.
By altering the central wavelength of pass band of the tunable filter, the whole input spectrum can be scanned at highspeed and spectrum information of incident signal is detected sequentially. The photo detector converts the light passing through the filter into electrical current. The data processing unit process the data and then outputs the processed spectrum to the computer for further data analysis and measurements .
Software application
Easy to use zooming capabilities and Quick translation of the signal trace
3 Modes for Analysis
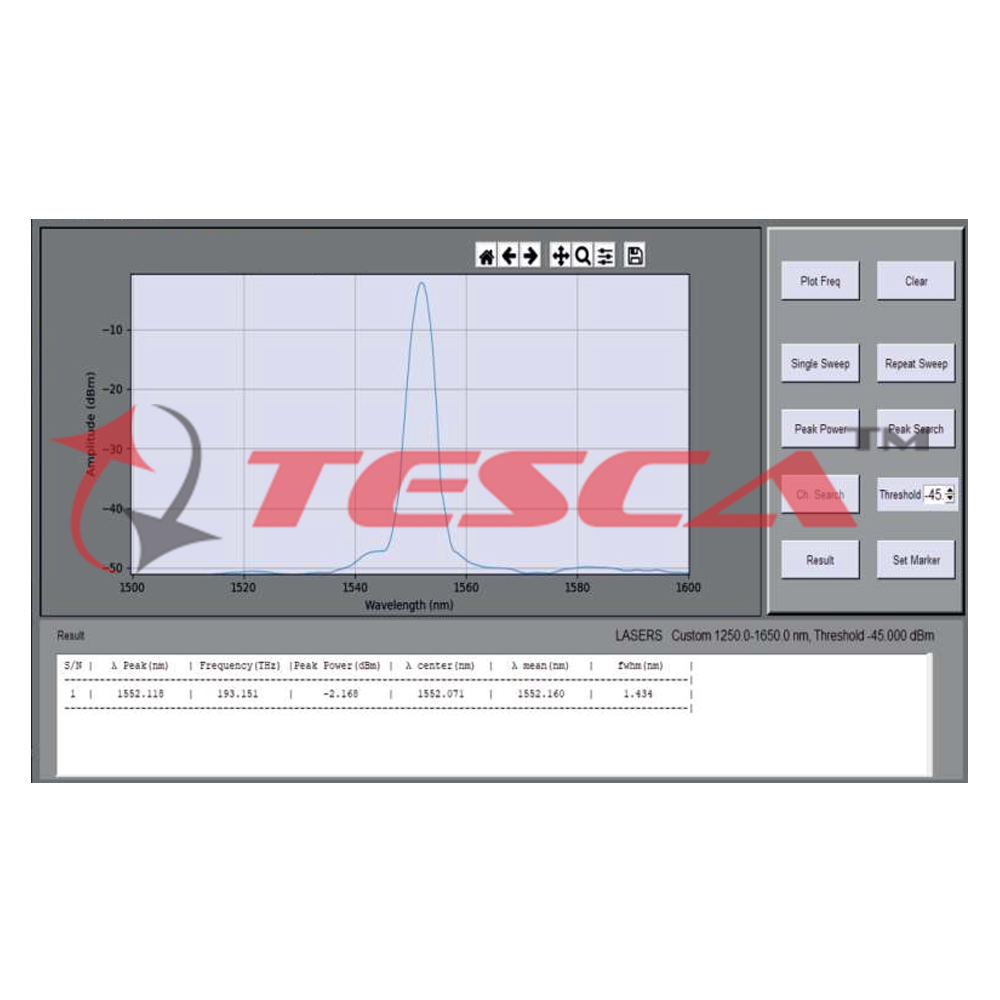
LASERS : To characterize a DFB Laser source for ?( central,peak,mean), Peak Power, Frequency and FWHM
CWDM : To Analyse CWDM Channels. Displays the Channel No. based on ITU Standards EDFA : To Analyze an EDFA System
- Sweep Band Selection in Custom Mode or ITU Band
- Displays the Plot in Frequency or Wavelength
- Save the graph in JPEG format
- Save the scanned data in excel format
- Save the extracted Results.
- Load Data to Software
- Compare multiple graphs with different colour codes.
Software application
- Plots the Wavelength or Frequency v/s Amplitude Trace Clears all previous Data.
- Scans for the Wavelength or Frequency once
- Scans for the Wavelength or Frequency repeatedly every 1 sec. Measures the Peak Power in dB
- Displays the parameters of the selected wavelength with highest peak
- Displays all the results, above the set threshold value in the Result window Two set of Markers to measure the ( ?(,)Δ?), power and Δ power.
- Identify the CWDM Channel No (as per ITU Standards),
- Displays all results
Specifications
|
PARAMETERS |
UNIT |
SPECIFICATION |
|
Operating wavelength range |
nm |
1250 ~ 1650(CWDM) |
|
Input power range |
dBm |
-50 ~ +15 |
|
Max input power d |
Bm |
30 |
|
Wavelength resolution (FWHM) |
nm |
2.5 |
|
Absolute wavelength accuracy |
nm |
± 0.3 |
|
Wavelength linearity |
nm |
0.05 |
|
Wavelength repeatability |
nm |
±0.1 |
|
Absolute power accuracy |
dB |
± 0.8 |
|
Relative power accuracy |
dB |
± 0.6 |
|
Power repeatability |
dB |
± 0.1 |
|
PDL |
|
dB 0.5 |
|
Noise floor |
dBm |
-55 |
|
Optical rejection ratio(at 20 nmoffset) |
dB |
> 40 |
|
Optical return loss |
dB |
> 40 |
|
Response time |
s |
> 1 |
|
Power consumption |
W |
< 2.0 |
|
Electrical interface |
|
USB |
Measurements
- Peak Power
- Peak Search
- Identify the CWDM Channel No (as per ITU Standards )
- Peak Wavelength in nm
- Central Wavelength in nm
- Mean Wavelength in nm
- Power in dB
Deliverables
- FOL-OSA: Optical Spectrum analyzer
- USB Cable
- Optical Measurement and Analysis Software
- Operating Manual
Enquiry Form
Related Product

Tesca specialize in doing turnkey projects that is fully operable when it is handed over to the project authority. Starting from inception to application training, Tesca provides the services as ONE source solution. Working side by side with government authorities and people across the World, we help countries to perform better. We support countries grow their economies, strengthen their education and health systems and improve financial management. We do this by providing consultancy & training in environment safety, education, health strengthening.
Category
Useful Links
Contact Us
International Sales:
 91-9829132777
91-9413330765
India Sales:
91-9588842361
2026 © All Rights Reserved.