
Pelton Turbine Demo Apparatus
Order Code: 32017
Category: Fluid Mechanics Lab
Tesca Pelton Wheel Demonstrator is an impulse transferred by the impact of a water jet on the runner fitted with buckets. The change in the momentum of the water jet results in the force on the buckets which turns the runner. The torque developed is ...
SPECIFICATION
Tesca Pelton Wheel Demonstrator is an impulse transferred by the impact of a water jet on the runner fitted with buckets. The change in the momentum of the water jet results in the force on the buckets which turns the runner. The torque developed is converted into useful work. Pelton turbines are used in hydro-electric power plants operating with water source available at high heads and low volume flow rates. It is essential for students to understand the characteristics of Pelton turbines. The Tesca Demonstration Unit is necessary equipment machinery for fluid mechanics educational institutions. Pelton turbine turbine and energy and its operations and performance Pelton Turbine for hydraulics laboratory is a very important part of the syllabus of fluid mechanics in educational institutions.
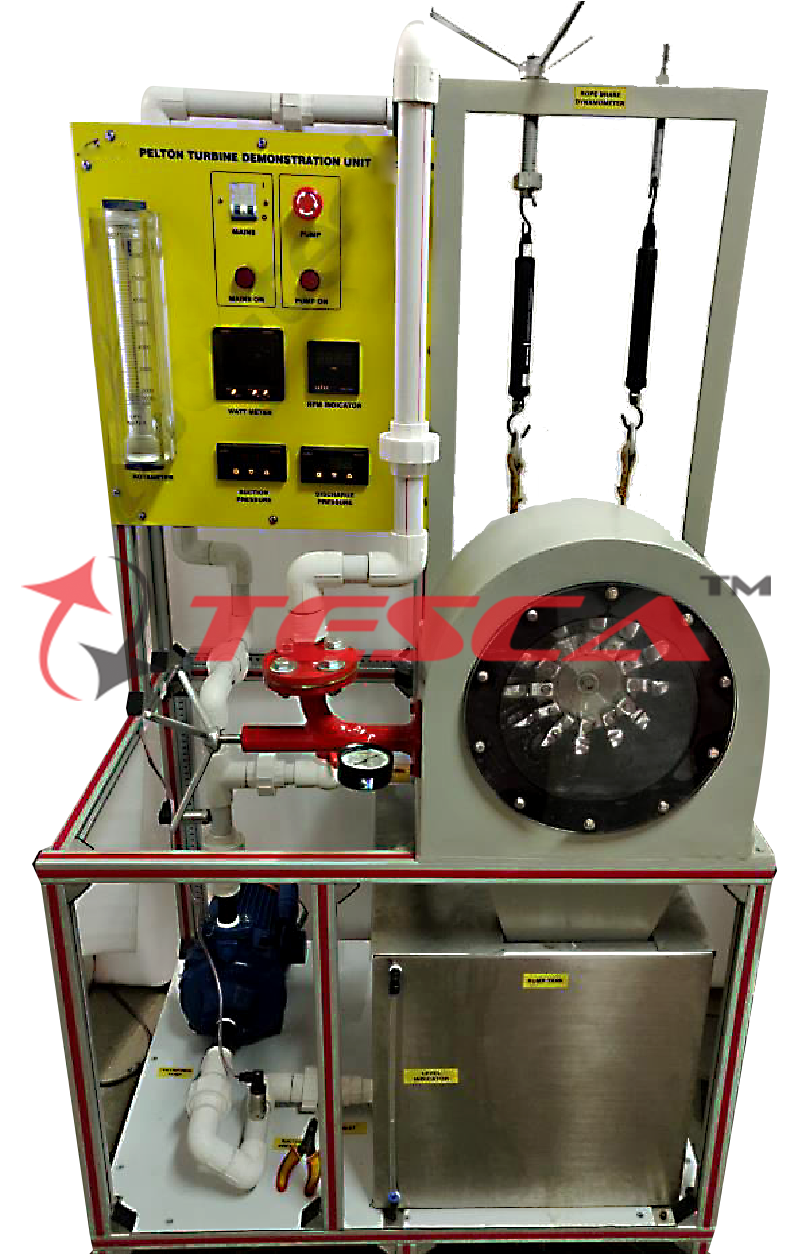
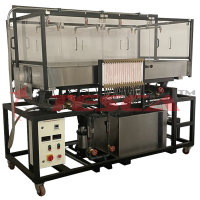
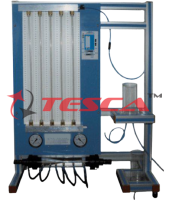
The Tesca Pelton Turbine Demonstration Unit has been designed to enable students to study the operation and characteristics of a typical Pelton turbine. The unit has to be connected to the specially designed Optional Water Feed System. The runner is mounted on a horizontal shaft and is fitted with buckets. A horizontal jet of water issuing from the nozzle produces a force on the bucket. The flow rate through the nozzle can be adjusted by varying the position of the needle valve inside the nozzle. The output of the turbine is measured using a brake band friction dynamometer. Digital RPM indicator with proximity sensor is provided to measure shaft speed. The runner and nozzle assembly is enclosed in a casing. The bottom of the casing is open and allows water leaving the buckets to drain. The front face of the casing is made transparent using Perspex to allow observation of turbines during operation. The unit is a compact and designed for quick and easy setting up of experiments. All components and instrumentation are placed in a robust and mobile frame.
List of Experiment:
1. Study of construction of Pelton turbine
2. D e t e r m i n a t i o n c o n s t a n t h e a d characteristics curve
3. Determination of constant speed characteristics curves.
4. Determination of constant efficiency curves.
5. Iso-performance curves
Important Features and Specifications: PELTON WHEEL TURBINE TEST RIG
a)
Number of buckets: 16
Drum Radius: 50mm Ÿ Bucket depth: 14mm Ÿ Jet diameter: 10mm
Shaft diameter: 10mm
Rated speed: @ 4000 rpm
Torque: 40N
Brake:
Pulley diameter: 60 mm.
Effective radius: 50 mm.
Water pump, computer controlled:
Maximum pressure: 7 bar.
Maximum water flow: 80 l/min at 5.4 bar.
Pressure sensor: 0 to 100 PSI (0 to 6.7 bar).
Load cell - force sensor: 0 - 50N.
Flow sensor: 2 to 150 l/min.
Speed sensor: 0 - 20000 rpm.
Water transparent tank, capacity: 130 l approx.
b) Flow measuring Unit:
A 50 mm (2“) Venturi meter/Orificemeter with double column differential manometer (Without Mercury) on a panel board to measure the difference of pressure. c) Reservoir of size 0.5 m length x 0.5 m width x 0.5 m. height with drain valve of ½ ” size & a bend. d) Starter, Switch, Digital speed indicator, Pipe line with gate valve
& foot valve etc.
COMPUTERIZATION (optional)
‘Sci-cal’ Software & Interface: ‘Tesca’ software, interface & related sensors enable plotting of required graphs through the formulae integrated into software. The students can carry out experiments and see graphs and results in ‘Labview’.
Depending on the measurement method, the measured values can be read off the analogue manometer or digital displays. The measured values are transmitted directly to a PC via USB. The data acquisition software is included.
1. Data Acquisition with high performance, various function parameters IP & OP.
2. Lowcost , Portable , compact , comprehensive, sturdy design
3. Fully instrumentation for experimentation of data acquisition of different parameters of refrigeration system & its calculations.
4. Direct reading of parameters like temperature, pressures, load and power measurement.
5. Very high -speed dynamic signal acquisition is possible.
6. Computerized Load control attachment as optional accessories.
System has the unique feature of direct reading & automatic calculating all efficiency & heat balance sheets of the system. The online graphical representation of important parameters is displayed on screen to see the effect of change in load. Final result & graphs are built available in software. System has facilities of measuring parameters like temperature at different locations, pressures, load, mass flow of refrigeration (Rotameter) and power measurement.
Windows based software is supplied with the CAPTURE range of equipment offering a complete teaching package of coursework and laboratory investigation.
The familiar Windows environment allows the student to explore the principles of each machine quickly and easily, highlighting the difference between theoretical and practical measurements, thus providing a good understanding of the principles involved.
This software runs under Windows operating systems and has been designed for maximum flexibility and ease of use. Comprehensive ‘Help’ screens guide the student through both the theoretical background and the practical investigation of the machine under examination. Suggested laboratory investigations and further questions for the student to answer are included in the software, together with all the information required to set up and run the teaching exercises.
SOFTWARE CAPABILITIES
This software includes a range of functions and capabilities designed to make the operation of the equipment and processing of the results more straightforward, and also to enhance student understanding of the subjects being covered.
It includes:
Diagrammatic representation of the equipment, complete with real time display of the various sensor outputs
Presentation screens, giving an overview of the software, the equipment, the procedure and associated theory
Detailed ‘Help’ facilities giving in depth guidance
Automatic data logging of sensor values into a spreadsheet format
Control over sampling intervals
Student questions and answers, including a layered ‘Hint’ facility
Processing of sampled values (this may be linked to the questions and answers to ensure student understanding)
Sophisticated graph plotting facilities of both measured and calculated values, including comparisons taken under
different conditions
Export of data to Microsoft Excel or other spreadsheets
Links to user defined word processor
Calibration facility for sensors
Real time bar graph display of sensor outputs
Recent history graphical display
Optional
Interface In-built Module:
This control interface is common for the ‘Tesca’ trainers and can work with one or several trainers.
The Control Interface is part of the SCADA system.
Control interface with process diagram on the front panel.
The unit control elements are permanently computer controlled.
Simultaneous visualization in the computer of all parameters involved in the process.
Calibration of all sensors involved in the process.
Real time curves representation about system responses.
All the actuators’ values can be changed at any time from the keyboard allowing the analysis about curves and responses of the whole process.
Shield and filtered signals to avoid external interferences.
Real time PID control with flexibility of modifications from the computer keyboard of the PID parameters, at any moment during the process.
Real time PID control for parameters involved in the process simultaneously.
Proportional control, integral control and derivative control, based on the real PID mathematical formula, by changing the values, at any time, of the three control constants (proportional, integral and derivative constants).
Open control allowing modifications, at any moment and in real time, of parameters involved in the process simultaneously.
Three safety levels, one mechanical in the unit, another electronic in the control interface and the third one in the control software.
Technical Details:
The analogue output data is digitized and transferred to a computer using the standard USB (Universal Serial Bus). This allows any standard modern Windows computer to be used, including notebooks, and does not require any internal access to the computer.
The equipment is supplied complete with a USB lead for connection to the computer. The 32017 Turbine Demonstration Unit interfaces to the computer via the provided devices and the USB port of the computer.
Also available is a software driver that allows the outputs to be read in other software programs, such as Labview.
Services Required:
1. Electrical supply, 220 V, 50 Hz.
2. Water supply and drainage.
Cables and Accessories, for normal operation.
Manuals supplied include Assembly and Installation, Interface and Control Software, Starting-up, Safety, Maintenance, Calibration & Practices Manuals.
Overall Dimensions:
Length: 1.3m x Width: 0.9m x Height: 1.1m
Enquiry Form
Related Product

Tesca specialize in doing turnkey projects that is fully operable when it is handed over to the project authority. Starting from inception to application training, Tesca provides the services as ONE source solution. Working side by side with government authorities and people across the World, we help countries to perform better. We support countries grow their economies, strengthen their education and health systems and improve financial management. We do this by providing consultancy & training in environment safety, education, health strengthening.
Category
Useful Links
Contact Us
International Sales:
 91-9829132777
91-9413330765
India Sales:
91-9588842361
2026 © All Rights Reserved.